
The majority of diagnostic tools today have a function that allows the recording of live data into LOG files. Before going out for a test drive it is necessary to select the required data that we want to record from the available list of "live data" of the specific car. When this is done all you need to do is press the start recording button. After coming back from the test drive it is necessary to download the recorded data into a PC and convert them to clear readable tables and generate graphs. This requires some PC and spreadsheet program knowledge and does take time.
Our new internet application LOGDECODER has the ability to bypass the majority of this work and within about 10 seconds the application completes these tasks automatically. The only task of the user is to determine which recorded data values he wants to combine together in the resulting common graph.
The number of graphs that can be created depends on the number of recorded values. Most commonly we want to combine 2 to 3 related values into one graph so that we can see their relationships in dynamic modes.
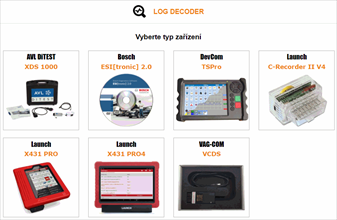
The supported tools and files (status 7.8.2019):
We will add other devices and file variants based on your interest.
Here is the link where you can purchase the LOG Decoder application: https://shop.fcd.eu/fcd-log-decoder/

The main function of the LOGDECODER internet application is the quick conversion of recorded LOG files from different diagnostic tools into Microsoft Excel graphs.

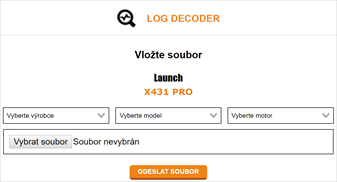
The user must select the diagnostic tool manufacturer for the recorded LOG file type and also the car manufacturer, model and engine code must be specified. Once this is done you select the required test drive LOG file from the PC and upload it to the application for conversion.

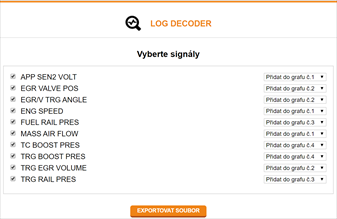
The LOGDECODER will return the decoded file and show a list of recognized values on the left side of the page. On the right side of the page, the user has the possibility through a drop-down menu to select a graph number into which to insert the specific value. This allows him to combine his own specific values into one common graph.

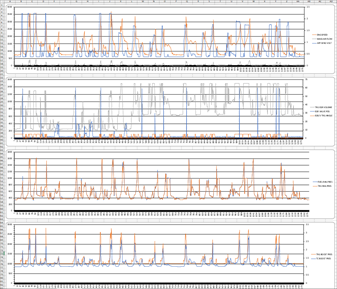
Open the downloaded file "fcd-log(1)" and on the second tab list, you will have all the graphs in the order as per your selection. It only takes about 30 minutes to produce your own clear and well-arranged graphs. The application will shorten this time to only about 10 seconds!

The LOGDECODER internet application has the capability to instantly convert data files from different diagnostic ScanTools into clear readable Microsoft Office Excel graphs.

Kompletní informace na toto téma
a mnoho dalších informací najdete pod odkazy níže.
Vyzkoušejte si nás nezávazně na 14 dní zdarma.
Vyzkoušet 14 dní zdarma
Komentáře (0)
Vložit soubor